
When to use Data Conversion vs Data Blending
Both Data Blending and Data Conversion live on the Data integration tab of every eligible data source’s settings page, behind the same on/off toggle. The two modes solve different problems — pick Data Blending to enrich existing ad rows with a complementary source, or Data conversion to turn a non-ad source into a standalone ad channel: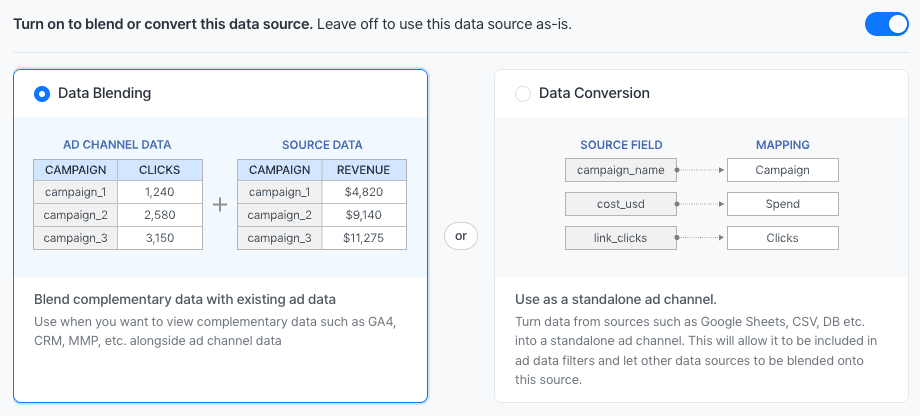
- Layering offline conversion or revenue data from a CRM onto ad performance
- Pulling cost data from an unsupported channel into a marketing widget
- Adding annotations, budgets, or targets stored in a spreadsheet
- Merging custom backend metrics with platform spend
Open the blend settings
Blend settings live on the data source itself:- Open the Connections menu and pick the data source.
- Open Data source settings.
- Open the Data integration tab.
- Toggle the integration on — the prompt reads “Turn on to blend or convert this data source. Leave off to use this data source as-is.”
- Pick Data Blending on the card group.
In earlier versions, blend settings could be edited from the pencil icon on a widget’s settings panel. That pencil icon now redirects to the data source settings page — blend configuration lives there and only there, so the same configuration applies to every widget that uses the data source.
Step 1: Date settings
Pick a date dimension from the non-ad source so the blend can filter by date. The format is detected automatically; enter it manually if detection fails. If no date dimension is selected, the non-ad source ignores the date breakdown on the widget — all values flow through regardless of the date range. Use this only when the source is genuinely date-agnostic (targets, mappings, dictionaries).Step 2: Join type
Pick Left Join to enrich existing ad rows with extra columns. Pick Full Join when the non-ad source should also contribute rows that have no ad-data match.
Step 3: Breakdown mappings
For each widget breakdown that needs a mapping, add a row. Each row pairs a target marketing field with a source field from the blended data. Constraints worth knowing:- Up to 15 widget-dimension rows per configuration.
- Each row supports up to 5 target-to-source pairs.
- A widget dimension can only appear in one row.
- The same target breakdown cannot be selected twice inside a single row.
- Custom architecture breakdowns are single-select per row.
The “default” row
In addition to specific widget-dimension rows, a default row can be added. The dashboard first looks for a mapping that matches the widget’s current dimension. If none is found, it falls back to the default row. Without a default and without a specific match, the row produces no result.Total mapping
The Total Mapping controls aggregation when the widget renders a single total instead of a breakdown — typically scorecards and single-value widgets. Pick the highest level that makes sense for the data (often Ad account or the source’s primary ID column), or pick No grouping to aggregate the entire source. Important: if Total Mapping is set to No grouping and the current widget dimension has no explicit mapping in the configuration, both Left Join and Full Join return an empty result. The default fallback is intentionally ignored in this case.Step 4: Metric mappings
For each metric the widget should compute, map the non-ad source field to the marketing metric. Multiple metrics can sum across both sources (for example, Ad Spend from Google Ads plus Ad Spend from a blended CSV). A field that already appears as a mapping condition in Step 3 does not need to be re-mapped here for filtering to work.Step 5: Save
Click Save. The data source is now blended and can be added to any widget alongside ad data sources.Automatic defaults
Several connectors ship with default blend settings already applied at creation time:- GA4 — UTM-based mappings on Ad, Ad Set, Campaign, Ad Account, plus a default fallback. Forced Left Join.
- HubSpot Deals — first-touch UTM mappings on keyword, ad, ad set, campaign, ad account. Forced Left Join.
Troubleshooting
The widget shows empty rows after a blend
The widget shows empty rows after a blend
The most common cause is No grouping as Total Mapping plus a widget dimension that has no explicit mapping. Add either a specific mapping for that dimension or set a default row.
Some rows appear that shouldn't be there in a Left Join
Some rows appear that shouldn't be there in a Left Join
For breakdowns outside the standard marketing list, blending defaults to Full Join behavior regardless of the join type chosen. The breakdowns that honor Left Join are: Channel, Ad account, Campaign, Campaign name, Ad set, Ad set name, Ad, Ad name, Keyword, Keyword text. All other breakdowns behave as Full Join.
A filter on a marketing dimension is being ignored
A filter on a marketing dimension is being ignored
A filter on a marketing dimension that is not included in any breakdown mapping or metric mapping is partially or fully ignored. Add the dimension to the mapping conditions, or filter on a dimension that is included.
Names changed in the source and the blend broke
Names changed in the source and the blend broke
Blend settings store source field names verbatim. If a spreadsheet column or database field is renamed, update the mapping manually.
The pencil icon on the widget panel didn't open an editor
The pencil icon on the widget panel didn't open an editor
Correct — it now redirects to Data source settings → Data integration. Blend configuration is owned by the data source, so editing happens there.